As you know, production is a group of multiple processes. It is natural that there will be defects in a process, or during the design and development of a product, dangerous incidents arising out of the product will be encountered that need to be avoided. It is imperative that managers evaluate such processes or events. And yes, care must also be taken to ensure that the defective product does not reach the customer. Therefore, it is necessary to detect, evaluate and prevent such faulty products, processes, equipment, or incidents. Hence, fault tree analysis (FTA) is a useful tool.
What is Fault tree analysis (FTA)?
The Fault tree analysis (FTA) is actually a method that makes it easy to analyze the failures of complex systems, especially those using algebraic methods. Which can be called Boolean logic method. In this method, top-down processes solve knots and find the events, processes, or other causes that lead to failure.
“Fault Tree Analysis [FTA] is a graphical / tree formation chart that helps to identify potential failure in processes / system. This systematic tool usually also helpful to determine prevention during design phase and production development.”
To effectively use the fault tree analysis feature in the system to eliminate faults and improve processes.
Take the following steps:
- First, we must understand the main events that cause the system to fail and the undesirable conditions to which these conditions lead.
- In any manufacturing process, focus on optimizing the processes, and also understand that the least number of resources are used to complete the processes.
- Monitoring the status of complex systems in processes is extremely important, as it allows us to understand how long processes can be run with defects. Also, what effect it may have on the product, etc…
Provides graphics to analyze a failed system or part of a process in any process. Visual content that identifies unreliable locations and processes that contain faults. which makes it possible to qualitatively or quantitatively analyze the reliability of processes and systems. Specialities are helpful in understanding, analyzing and debugging complex systems.

The Fault Tree Analysis is problem identifier tools using logical method, that helps to bring at mode at event which is responsible for potential failure in system / Processes.
Key Goal: Identifying failure event.
Method: Representing Graphic Tree View format to visualize relationship between main system and sub-system.
Usual Symbols: Top Event symbol, OR Gate, And Gate, Basic Event System.
Instant Example:
Imaging if your “Bike does not start” and you wish to identify problem. What you will do next? Using FTA, you can identify failure event.
(A) Use OR Gate: There may be two reasons behind this issue: (1) Electrical Issue (2) Fuel Issue
(B) Use AND Gate, With Electrical fault – there will be two reasons – either cold weather or battery low (or failed) or both
(C) Use OR Gate, With Fuel fault – There will be also two reasons – either empty tank or fuel supply issues or both
Now, you can easily identify where the problem is? This may be helpful.
A simplified method
- Step 1. Define an undesirable event.
- Step 2. Search for causes
- Step 3. Quantitatively analyze and resolve fault trees
- Step 4. Consider steps and make improvements.
Whenever a subsystem fails, the main system or other connected systems are adversely affected, resulting in the failure of the main system as well. A particularly complex process group or system has one or more sub-systems that can be understood and corrected through fault tree analysis. So, the question is how to implement this process. Here we will see the general steps of fault tree.

Step 1. Define an undesirable event.
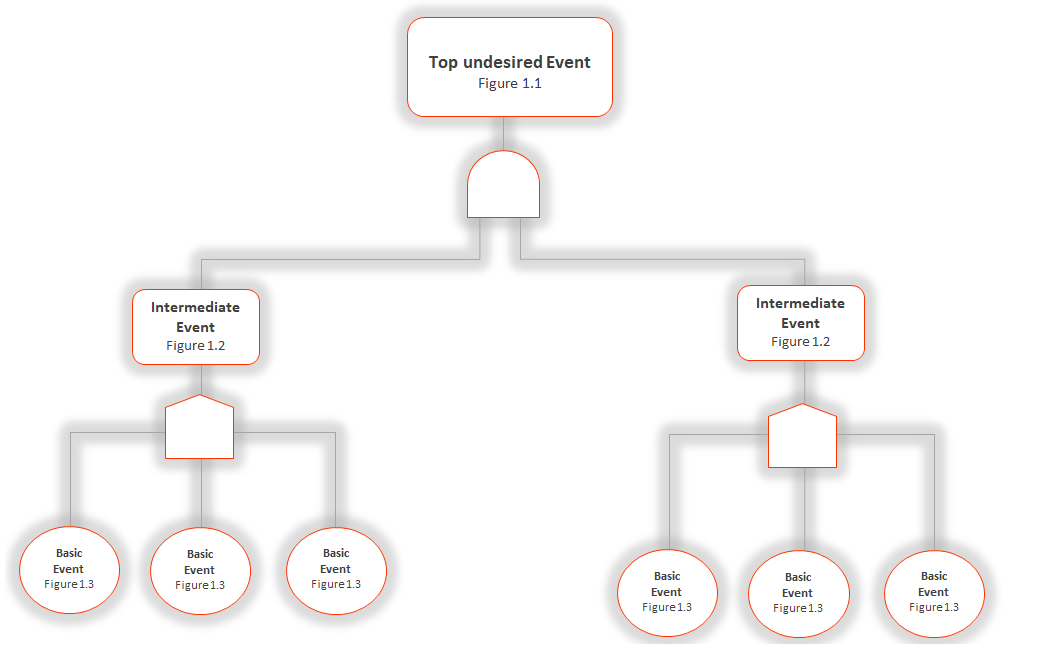
These steps are particularly focused on the topic. Here, we need to define all failures by placing the failures occurring in the processes at the “top of the tree”. If these are fully and accurately determined, the cause of unwanted events and failures can be easily traced.
Look at the picture above there “Figure 1.1” shows – Top undesired event.
Step 2. Search for causes
When you complete the first step does it mean that you have displayed the main subject object, which indicates what is the failure? and where is So that all the immediate causes connected with the incident are easily resolved. Within these steps you can understand how far the analysis boundary is to be displayed. And it becomes easy to define it clearly.
Look in the picture above there it shows “Figure 1.2” – Intermediate event.
Step 3. Quantitatively analyze and resolve fault trees
This step is a type of resolution, where key actions, procedures, methods and basic occurrence probability of the event are analyzed. In fact, this step continues until the underlying causes are identified. Here we can give different levels like “very high”, “high”, and “low” for analysis of probabilities. Which presents possible sub-events responsible for the higher event.
Look in the picture above there shows “Figure 1.3” – Basic event.
Step 4. Consider steps and make improvements.
A fault tree diagram is actually a logical analysis, which displays the relationships between the events that occurred. But just finding the cause should not be the ultimate goal. Here we have to solve the problem and remove the obstacles. All critical failures that occur must address the root cause and consider actions and solutions to correct failures and deficiencies.
Why do we use fault tree analysis?
As we know, we have many tools through which we do various analysis, which proves to be very useful for business. Also Fault Tree Analysis (FTA) is one of them.
Using this we can identify different combinations of defects, failures, or human errors in products or processes. Also, by analyzing it, unexpected and unexpected events like accidents or system failure can be prevented.
It is a valuable tool for understanding any difficult or complex system, and identifying the most likely most severe failure scenarios. The main reasons for using fault tree analysis are:
To increase safety
Be it any kind of business, but when we use heavy machinery, tools and other equipments in manufacturing sectors, chemicals are also used which can harm human beings in the long run. So it is very important to take safety measures in such production areas. As such, fault tree analysis (FTA) is very useful for ensuring system safety and protecting against accidents in industries such as nuclear power, aviation, and chemical processing in general.
In order to ensure the safety of personnel and the environment in any industry, it is necessary to use the necessary tools to identify and minimize potential failure situations.
Reliability
First of all, we are explaining one thing that, when does reliability come?, obviously, When you experience it.
For example, in a steel industry, you see that each rotating parts of machine have installed special type of steel nets, so that the hands do not comes into the rotating parts.
But how will the management get the seriousness about this?
The answer is, specialized tools like FTA. FTA is also used to improve system reliability. By identifying and mitigating the most severe failure scenarios, FTA helps ensure that systems are available and functioning as intended when they are needed.
Compliance
Many industries and regulatory agencies require the use of FTA as part of their safety and risk management protocols.
By using FTA, companies can demonstrate compliance with regulations and industry standards.
This is particularly important for industries such as nuclear power, where regulatory compliance is critical to ensure the safety of employees and the environment.
Cost-effectiveness
As we know, FTA can identify the most likely and most severe failure scenarios, and help prioritize safety and reliability efforts.
This enables business decisions to be made, which can save costs by avoiding unnecessary costs for locations where it is not necessary (less critical areas or unlikely failure modes).
Decision Making
When management takes a decision, it affects the entire business. So that decision is considered important. It is obvious that the management does not make any decision unpredicted or baseless, but uses complete information and special tools to understand the situation and then arrive at a decision.
FTA is also an important tool, using which management identifies and evaluates potential failure scenarios. Information through FTA can help make informed decisions about system design, maintenance, and operation.
By identifying and evaluating potential failure scenarios, decision makers can make informed decisions about how to allocate resources, and prioritize safety and reliability efforts.
Continuous improvement:
Any analytical tool is successful only when it is updated regularly. FTA is also not a one-time analysis, it has to be regularly reviewed and updated.
By doing this, we can ensure that all systems run smoothly. Also, the safety and reliability of the system is constantly improving.
As the system and its components continue to change, new failure scenarios may arise. Regular review and updating of the FTA process is therefore essential to ensure that the model is accurate, up-to-date and effective in identifying and mitigating failure scenarios.
Different between FTA Qualitative and FTA quantitative
Fault tree analysis (FTA) can be performed both qualitatively and quantitatively, and both methods have their advantages and disadvantages.
Indeed, the exact use-case depends on the event and available information.
FTA QUALITATIVE | FTA QUANTITATIVE |
|---|---|
| In this type of analysis, common language and diagrams are used when we describe the fault tree. | Whereas in qualitative type of analysis mathematical equations are used to describe the fault tree. |
| Can identify potential failure conditions in production areas and the events that can lead to them. | In this, one can calculate the probability of failure and the probability of certain events occurring. |
| This can provide a more in-depth understanding of the system and its failure conditions, and is useful when information is unavailable, or uncertain. | This provides a detailed, objective and reliable understanding of the probability and consequences of failure scenarios in the system. which society needs to make cost-effective and accurate decisions. |
| Often used in the early stages of analysis. | Often used in later stages of analysis, after potential risks have been identified. |
Deep AnalysisWhen the business feels that there is a need for deeper tapas, this type of analysis is needed. | Safety MeasuresCan be used to evaluate the effectiveness of safety measures and identify the most critical areas for improvement. |
| Useful for creating a general understanding of the system, and identifying potential risks. | Useful for risk analysis and decision making, as it can provide a quantitative measure of risk. |
| The results are subjective, and depend on the skill of the analyst. | Whereas here, the results are objective and reproducible. |
| It uses non-numerical data, such as observations, interviews, and expert judgement, to understand the system and its failure modes. It does not use numerical probabilities, but instead, relies on expert judgement to identify the likelihood and outcome of events. The analysis is done by identifying and evaluating the contributing factors and the causal relationships between them. The results of the analysis are presented in descriptive form, and it is not possible to quantify the uncertainty of the results. | Here, numerical probabilities and mathematical calculations are used. It models various ways in which systems can fail. It assigns numerical probabilities to basic events and gates, which represent the probability of each event or combination of events. These probabilities are usually derived from historical data, expert judgment, or other sources. The fault tree is then analyzed using mathematical algorithms, which calculate the overall probability of the peak event as well as the probability of individual paths in the fault tree. The use of numerical probabilities and mathematical calculations in FTA makes it a quantitative method. |
In conclusion, both Qualitative FTA and Quantitative FTA have advantages and disadvantages. The choice between them depends on the specific use cases and available information. In general, if information is available and accurate, Quantitative FTA is a more reliable and accurate method, while Qualitative FTA is more useful, when information is unavailable or uncertain.
FTA Graphic Symbols
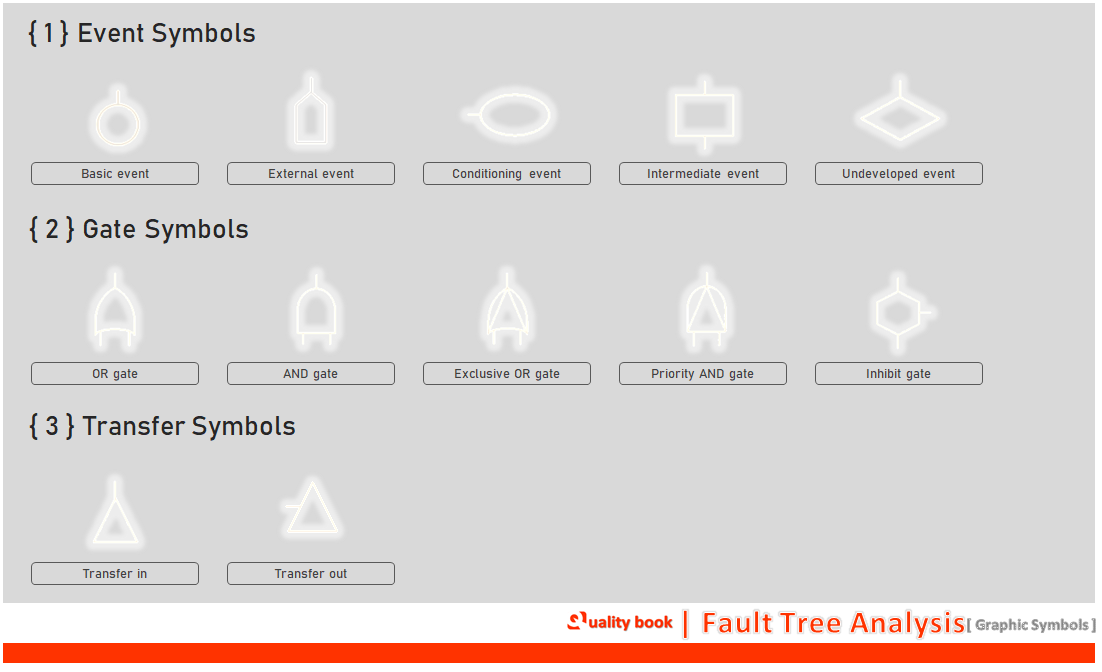
When you create a fault tree analysis, you can use your own graphical symbol that you standardize for your business. But mostly businesses use internationally recognized symbols which are as follows. These graphical symbols are used to understand main, sub-events and causal relationships. Here graphical symbols are of three types, which are event symbols, gate symbols, and transfer symbols. Especially useful are gate symbols, which are considered logical symbols.

Event symbols
These types of symbols are used to represent primary and intermediate events. which leads to basic events as a logical gateway to intermediate events. Event symbols represent failures in a key component or element, thus forming the foundation of your tree analysis. These symbols are basically of three types, which are basic event symbols, external event symbols, and conditioning events.
Gate symbols
Actually, gate symbols play an important role in fault tree analysis. These symbols are Boolean logic symbols that describe the relationship between input and output. There are six gate symbols in total here. They are the OR, AND, exclusive OR, priority and gate, and inhibit gate symbols used in FTA. Commonly used symbols are OR gate and AND gate.
Transfer symbols
Symbols of this type are especially used to indicate that inputs and outputs related to fault tree analysis are connected together. You can understand how a sub-system is connected to its main system to represent it.
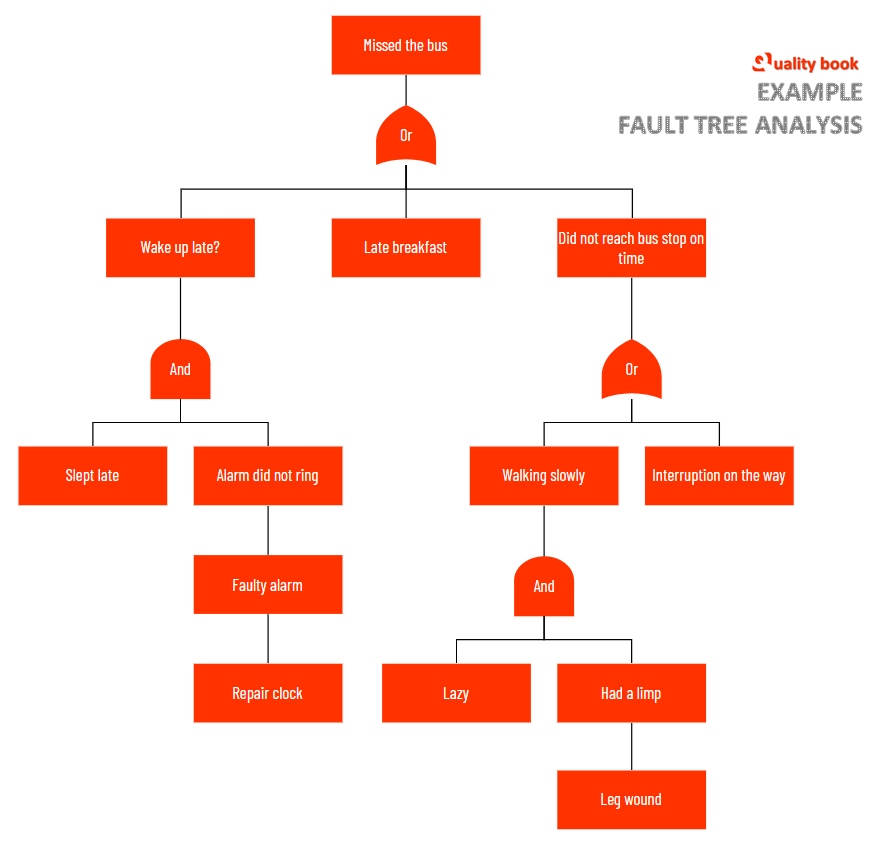
Example for simple explanation
FTA is really useful when you use it for complex systems and analyze fault events. You can take a straightforward approach to creating this and display a summary of each step.

As seen in the above picture, if a person misses a permanent bus, then doing a fault tree analysis for that, one can find out which root causes are actually responsible for all the incidents.
And yes, one thing to keep in mind is that the FTA model is meant to analyze only one undesirable event, it later leads to some other fundamental event or undesirable event.